文章內容
Chromaticity diagram

❒ Visible light with different wavelengths exhibiting different colors
The electromagnetic spectrum is shown in Fig. 1. The visible light with different wavelengths will exhibit different colors for human eyes. The visible light is the light the human eyes may see, and may be approximately divided into seven color blocks, i.e. red, orange, yellow, green, blue, cyan and violet. As shown in Fig. 1, the wavelength of red light is about 0.78μm and the wavelength of violet light is about 0.38μm, so the red light has longer wavelength, lower frequency and lower power, and the violet light has shorter wavelength, higher frequency and higher power. Clearly, the wavelength of light wave is inversely proportional to frequency, and the frequency is directly proportional to energy.
.jpg)
Figure 1: Visible light has infinite colors to form continuous optical spectrum.
❒ Principle of three primary colors
Here are few examples for describing how to combine the three colors, Red (R), Green (G) and Blue (B) in different brightness to form nearly all colors in visible light. Assuming using one square to display one color, this square is called “pixel.” The square may be vertically divided into three small squares to respectively representing red, green and blue colors. These small squares are called “sub-pixel,” as shown in Fig. 2. When the red is in 100% brightness (full bright), the green is in 100% brightness (full bright), and the blue is in 100% brightness (full bright), the three colors will be mixed as white by our vision, as shown in Fig. 2.
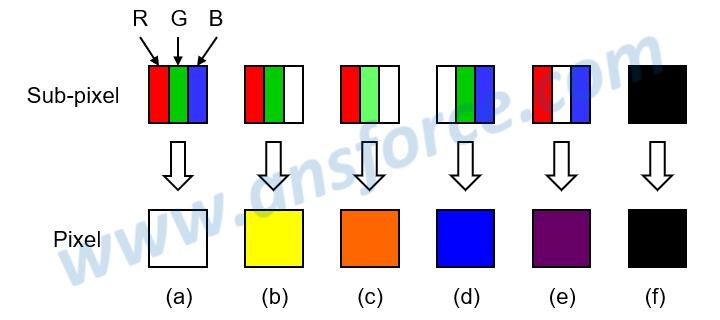
Figure 2: Three sub-pixels containing Red (R), Green (G) and Blue (B).
❒ Meaning of chromaticity diagram
Visible light is the light the human eyes may see and has infinite colors. Scientists drew these colors on a Chromaticity diagram, which looks like the shape of horse’s hoof. All the colors the human eyes may see are within the horse’s hoof. The wavelength of the light represents the color, so how many wavelengths the light may have means how many colors there will be. Thus, the light may have infinite colors. The aforementioned red (R), green (G) and blue (B) colors are actually an approximate visual sense. The light generated by different light emitting devices may have somewhat differences therebetween, so the color generated by different light emitting devices may be different.
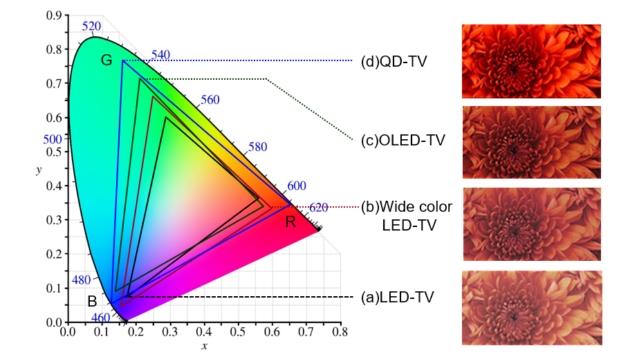
Conventionally, a LCD-TV using White LED (WLED) as backlight source is called “LED-TV.” Although the manufacturer called it “LED-TV,” it is actually a LCD-TV using LED as backlight source and utilizes the color filter to generate three color light (RGB). As shown in Fig. 3(a), the apex of the black triangle is the three colors (RGB), and the colors within the triangle are all the colors this type of TV is able to combine. The larger triangle means there could be more combined colors and the colors will be more real. It can be seen in the figure that because the triangle is smaller than the horse’s hoof, this type of TV clearly cannot compose all the colors the human eyes may see, but these colors are sufficient to compose the real image on the TV for us.
Later, some manufacturers developed different type of WLEDs, which may generate three colors (RGB) with the color filter and enlarge the red triangle on the chromaticity diagram, so as to compose more colors, as shown in Fig. 3(b), which is called Wide Color Gamut LED-TV. These two types of TVs both utilize the color filter to filter out white light to generate three colors (RGB). However, the colors of WLED applied for industrial backlight source are currently still limited, so the composed colors are still not enough. It can be seen in the figure that the three colors (RGB) generated by Organic LED (OLED) TV may compose larger green triangle, so that it can exhibit more colors, as shown in Fig. 3(c); and, the three colors (RGB) generated by Quantum Dot TV (QD-TV) may compose an even larger blue triangle, so that it can exhibit more colors, as shown in Fig. 3(d).
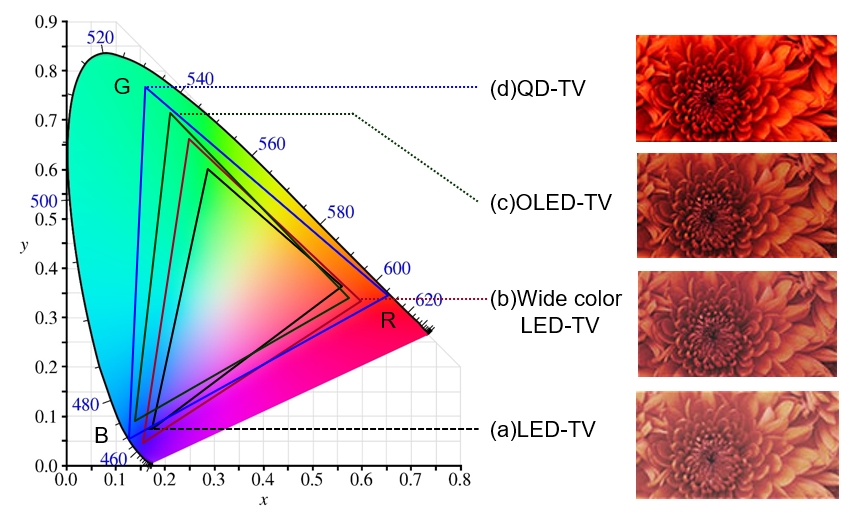
Figure 3: Chromaticity diagram.
【Remark】The aforementioned contents have been appropriately simplified to be suitable for reading by the public, which might be slightly differentiated from the current industry situation. If you are the expert in this field and would like to give your opinions, please contact the writer. If you have any industrial and technical issues, please join the community for further discussion.